Monte Carlo simulations can be useful in providing insight into a number of problems, including, of course, retirement finance. However, interpreting the results and appreciating their limitations relies on some understanding of the underlying probability distributions. Having recently implemented a Monte Carlo solution (the details of which are not important here), I was struck by a number of questions each of which I have made some attempt at answering.
1) How well can the probability distribution of annual returns (if there is one) be determined from historical data?
2) If a particular distribution is assumed, how representative are the mean and standard deviation derived from the historical data likely to be?
3) Related to Question 1, it has sometimes been postulated that the distribution is ‘fat tailed’ – what is the probability that this arises by chance?
4) Is mean reversion (e.g., see https://www.bogleheads.org/wiki/Mean_reversion) unique to historical, as opposed to simulated, returns?
In brief, the answers to those questions appear to be not very, about two percentage points, roughly 20% to 30%, and no. The details are given below and in subsequent posts. I don’t pretend that this analysis is unique, since many others have looked at these and other questions, but I thought the results were interesting enough to post.
Question 1 How well can the probability distribution of annual returns be determined from historical data
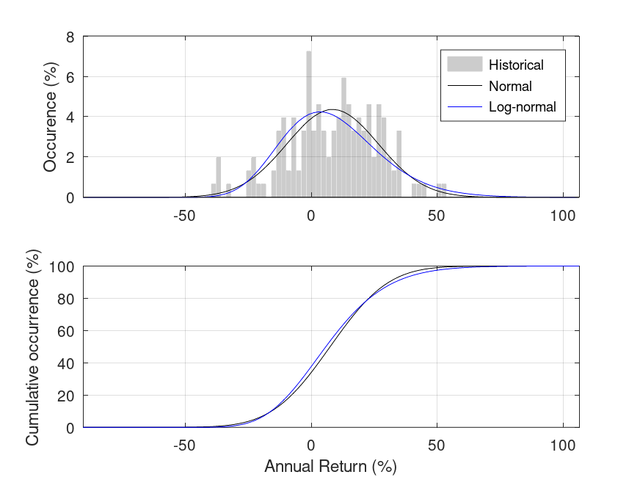
In the following figure, the upper panel shows the probability density function (pdf) for historical data (annual real returns for TSM from 1871 to 2023, drawn from the Simba spreadsheet rev23b) and normal and log-normal distributions (the normal distribution has a mean=8.5, std=18.2, which correspond to the arithmetic mean and standard deviation of the historical data, 4.5e7 samples have been used). The lower panel shows the cumulative distribution function for the normal and log-normal functions only.
![Image]()
There are a few things to note from the graphs:
1) Given the small sample of 153 years in the historical data, the resulting pdf is highly variable, although, by eye, it shares some resemblance to both the normal and log-normal distributions (although it is not clear which is ‘best’).
2) Some of the variability in the pdf derived from the historical data appears in the tails – e.g., the number of years which have seen a return around the -40% mark is much higher than expected from either the normal or log-normal distributions.
So, assuming that the returns are a) random and b) are drawn from some fixed distribution (which in itself is not certain), then it would appear that, given the limited length of the historical record, the precise distribution of the annual returns cannot be determined from the historical data.
cheers
StillGoing
1) How well can the probability distribution of annual returns (if there is one) be determined from historical data?
2) If a particular distribution is assumed, how representative are the mean and standard deviation derived from the historical data likely to be?
3) Related to Question 1, it has sometimes been postulated that the distribution is ‘fat tailed’ – what is the probability that this arises by chance?
4) Is mean reversion (e.g., see https://www.bogleheads.org/wiki/Mean_reversion) unique to historical, as opposed to simulated, returns?
In brief, the answers to those questions appear to be not very, about two percentage points, roughly 20% to 30%, and no. The details are given below and in subsequent posts. I don’t pretend that this analysis is unique, since many others have looked at these and other questions, but I thought the results were interesting enough to post.
Question 1 How well can the probability distribution of annual returns be determined from historical data
In the following figure, the upper panel shows the probability density function (pdf) for historical data (annual real returns for TSM from 1871 to 2023, drawn from the Simba spreadsheet rev23b) and normal and log-normal distributions (the normal distribution has a mean=8.5, std=18.2, which correspond to the arithmetic mean and standard deviation of the historical data, 4.5e7 samples have been used). The lower panel shows the cumulative distribution function for the normal and log-normal functions only.
There are a few things to note from the graphs:
1) Given the small sample of 153 years in the historical data, the resulting pdf is highly variable, although, by eye, it shares some resemblance to both the normal and log-normal distributions (although it is not clear which is ‘best’).
2) Some of the variability in the pdf derived from the historical data appears in the tails – e.g., the number of years which have seen a return around the -40% mark is much higher than expected from either the normal or log-normal distributions.
So, assuming that the returns are a) random and b) are drawn from some fixed distribution (which in itself is not certain), then it would appear that, given the limited length of the historical record, the precise distribution of the annual returns cannot be determined from the historical data.
cheers
StillGoing
Statistics: Posted by StillGoing — Fri Aug 02, 2024 1:31 am — Replies 12 — Views 792