I just finished my taxes and had an unwelcome surprise of several K $ extra compared to my very detailed modeling of estimated taxes. The culprit is VG dropping the ball on tax efficiency for 2023 across the board in its International Funds.
I was annoyed enough to do a multi-year numerical analysis to see if this is a one-off or actionable. Below is the detailed analysis including various components of this inefficiency showing that some commonly discussed views (index selection) are NOT the main issue.
Summary QDI -> non-QDI dividend increases taxes by ~2X. For 2023 VG delivered ~15% worse QDI in its main International funds compared to both a) iShares equivalents for 2023 b) VG own funds for 2022. The TER (Tax ER) compared to a straight swap is 8 BP and for a more complex swap (Dev in Taxable + Emerging in tax deferred) ~17 BP. Index Selection doesn't seem to be the main cause. Likely cause seems to be fund structure: VG uses single fund, multiple shares class covering both taxable and tax deferred. This structure can't optimize BOTH taxable/tax deferred simultaneously. Blackrock offers (IMO) a more tax efficient mouse trap by using a different fund structure: ETF for taxable and CIT for retirement/401K.
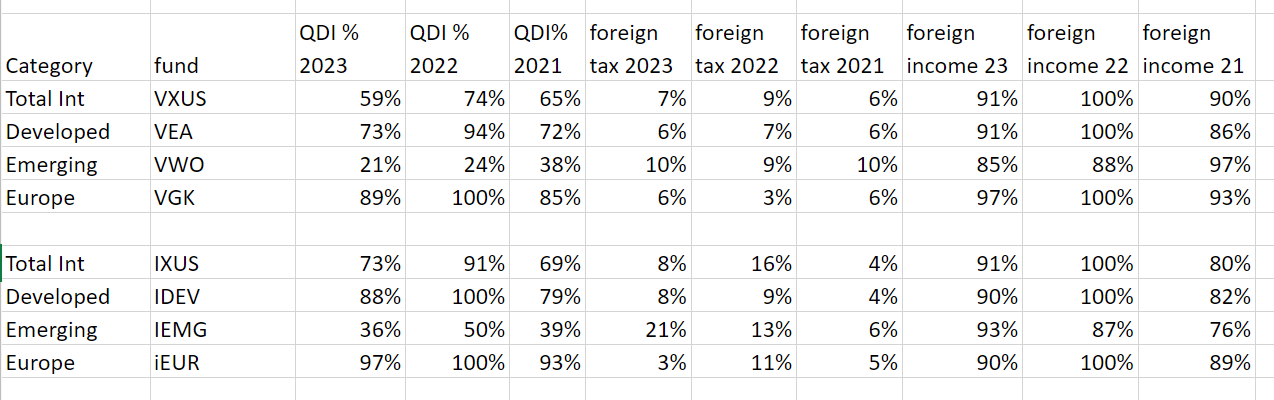
Data
Image may be NSFW.
Clik here to view.
Data Sources
Vanguard
https://advisors.vanguard.com/content/d ... SFTCWS.pdf
https://personal1.vanguard.com/pdf/FTC_2023.pdf
https://personal1.vanguard.com/pdf/FASF ... 012022.pdf
Blackrock/iShares
https://www.ishares.com/us/literature/t ... tamped.pdf
https://www.ishares.com/us/literature/t ... tamped.pdf
https://www.ishares.com/us/literature/t ... ummary.pdf
QDI Differences for Equivalent Funds
Image may be NSFW.
Clik here to view.
Looking at 2023 vs. 2022, within VG, we see that the main International funds of interest to Bogleheads (Total International, Developed, Emerging) were worse by ~15%. Looking at the next chart which focuses on Blackrock vs. VG performance each year, we again see ~15% for 2023.
Tax Expense Ratio (TER) QDI -> non-QDI classification of a dividend raises your taxes by ~2X. For higher tax brackets, QDI-> non-QDI moves tax bracket from 20% -> 37% or a 17% increase. At lower tax brackets, it moves from 15% for QDI to ~30-32% for non-QDI. I averaged both brackets to get ~17% increase for QDI -> non-QDI. State taxes usually don't care about QDI (for the states I have lived in). 12 month trailing dividend yield across these funds was ~3.3% (~2-2.25X of US funds). NIIT is applicable to all so irrelevant to this discussion.
A straight swap from say VXUS -> IXUS or VEA -> IDEV or VWO -> IEMG would generate: dividend yield * QDI difference * tax bracket difference = 3.3% * 15% * 17% = 8.4 BP.
A more complex swap would be to move emerging from taxable to tax deferred (it is getting ridiculously tax inefficient in taxable) and only keep developed in taxable. That would lead to ~30% improvement in QDI, leading to ~3.3%*30%*17% = 17 BP.
Given ever present discussions here on Bogleheads about 1-2 BP differences in funds, these tax differences (TER) are IMO meaningfully larger numbers and overshadow any actual fund ER differences.
Causes of Tax Inefficiency
Different Index: In previous discussions, several folks have argued that MSCI vs. FTSE index followed by ishares vs. VG could be the cause for tax inefficiency. I looked into it and the index differences are far too small.
First consider developed Europe. Vanguard Europe ETF (VGK) and ishares iEUR both track developed Europe all cap. Most of the market cap comes form western Europe (including UK), where countries have historical ties to US and often have tax treaties to avoid double taxation. Getting good QDI should be easy here and indeed iEUR delivers close to 100% QDI (sometimes even better than US local funds like VTI). Yet VG (VGK) trailed by 8% on QDI.
Next lets consider IDEV vs. VEA for developed. Here the main difference is Korea: VG classifies it as developed while MSCI/ishares classifies it as emerging. Both classify Taiwan as emerging Image may be NSFW.
Clik here to view.
According to VG, Korea is ~4.4% of VEA so it can't explain > 4.4% difference in QDI. Next level of accuracy, looking at Korea's dividend yield and QDI, I used the Korea country specific ETF from ishares EWY. It has 12 month trailing yield of 2.8% and QDI of 44%. VEA had ~3.3% yield and QDI of 73%. So if we remove Korea from VEA to basically create IDEV, we find that the QDI should improve by <1.5%. The actual QDI was off by 15% or ~ 10X bigger than the index difference due to Korea. Clearly, index is not the big factor in this case.
Similarly, for total International (VXUS vs. IXUS), the slight difference is handling of A vs. H shares for China. All of China is only ~6.5% of IXUS (or VXUS) so a slight difference in A vs. H (small part of this 6.5%) can't lead to 15% difference in QDI.
Overall, I conclude that the actual QDI difference delivered is ~1 order of magnitude larger than anything explained by index selection. So, then what explains it?
Taxable vs. Tax deferred optimization by Fund manager
For taxable, ideally we want 0 or low dividends, all of which should be QDI. Foreign taxation is compensated by FTC. Making distributions QDI may increase Foreign Taxes but that is a good tradeoff due to FTC. In tax deferred, dividends and QDI are irrelevant other than their impact on Foreign taxes. Foreign tax minimization should be a primary goal due to double taxation (no FTC).
These optimizations are somewhat opposite. If a fund has to span both taxable/tax deferred (Vanguard), it needs to chose. If separate investment vehicles are used by the Fund company e.g. Blackrock, they can do somewhat better with same level of competency.
A fund manager has little control over total dividends (once index is selected), other than sampling. They have considerable leeway on QDI and foreign taxes.
Most obvious are ADR holdings. By law, stocks held in some countries can't be QDI. Consider Taiwan. It is ~5% of VXUS/IXUS and also has the world's largest company outside US (TSMC). Its dividends were classified 100% non-QDI as seen by the country specific ETF EWT from ishares. However, holding TSMC as its ADR would lead to 100% QDI Image may be NSFW.
Clik here to view. . So QDI is not fixed.
Security lending is another obvious lever around the 60 day period of QDI/non-QDI dividend. Interestingly, foreign tax withholding can be optimized depending on the entity being lent to. Sampling vs. full replication is a factor.
The main thing here is that QDI and Foreign Taxes are not constants and may move in different directions depending on these optimization decisions. So, lets look at FT data
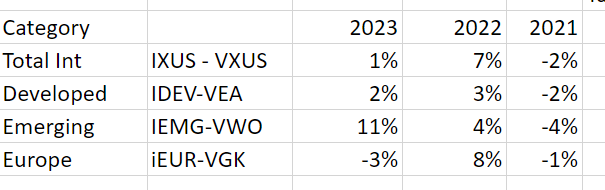
Foreign Tax Differences for Equivalent Funds
Image may be NSFW.
Clik here to view.![Image]()
Note that to get a sense of equivalent numbers in comparing the QDI and FT chart, QDI should be multiplied by 0.17: a 10% change in QDI is ~same as 1.7% difference in FT. So, these tax differences are meaningfully large.
The top chart shows that VG has delivered a much more controlled range in FT. The range from iShares is much larger. Looking at some outliers, for 2022 the Europe ETF withheld ~4X higher taxes than VG and IXUS withheld ~2X more taxes than VXUS Image may be NSFW.
Clik here to view. . Similarly for 2023 IEMG withheld ~2X taxes of VWO. Overall VG has provided much tighter control in the last couple of years on FT. I don't worry about FT withholding in taxable due to FTC but would be cautious about holding ishares ETF in tax deferred (or if someone can't claim full FTC for some reason).
IMO all this shows that VG and iShares are doing different optimizations due to fund structure.
Vanguard fund total assets in taxable vs. tax deferred
VG has an advantage over traditional mutual fund companies due to its patented innovation of bolting an ETF class onto mutual fund (and classifying all as share classes of the same fund). This lets them be better for capital gains in taxable. However, being share classes of the same fund, it has no way to differentiate between taxable/tax deferred. For optimization, lets look at how much of VG is in different buckets.
For US total Index Fund (VTI), out of total assets of 1.5T, its ETF class VTI has 356B = 24%. For total international VXUS, the total assets are 398B and ETF class VXUS has 63B = 16%. ETF and admiral shares are used in both taxable/tax deferred but the total assets are still dominated by the institutional+ type of classes which are used in 401K. It makes sense given these ratios, that VG fund managers need to weigh tax deferred optimization heavily.
Blackrock has the advantage because its ETF and CIT may follow similar/same index but are not different share classes of the same fund (my understanding). As such, they could potentially be optimized separately (meaning the higher FT seen in ishares ETF may not show up as a problem in tax deferred CIT).
Tax deferred benchmarking
To see if my hypothesis is correct, I looked into benchmarking my 401K funds. I am lucky to have both VG and Blackrock funds in my employer 401K. Their absolute 10 year performance appears identical (with small leeway for index selection). So, I don't see any obvious foreign tax disadvantage with Blackrock when benchmarking in 401K.
I can't obviously link to my employer 401K benchmarking data so lets try using public data. For VG, benchmarking is trivial as the same funds are available (1 BP lower due to share class). For Blackrock, I couldn't find the exact equivalent to the total international in my 401K but this fact sheet from Schwab is the closest I could find.
https://content.schwabplan.com/funddetail/ACWIXUSM.pdf
Note that there are some gotchas in reading their benchmarking charts. VG uses a gross index to show its tracking either on its own site or say using Morningstar. The Blackrock fund in my 401K and a similar one I linked to at Schwab, uses a net index MSCI ACWI ex USA Net Dividend Return Index. This index already removes Foreign taxes without disclosing how much withholding. So, you can get a false sense that it is doing much better than it actually is. Notice that the Schwab link says the fund has outperformed its index by ~20 BP each year averaged over 10 years, implying a negative ER and amazing performance. That isn't real because it is comparing to the NET index. What it DOES show is that foreign tax hasn't been a huge issue in its tracking.
I think mixing gross and net indexes is misleading and I used absolute returns for both in my 401k and VG, Blackrock are very close.
Conclusion: For 401K/tax deferred accounts, mutual funds or CITs by the big players for International seem fine. If I needed to hold ETF in tax-deferred (I don't need to due to excellent 401K funds) I would prefer VG due to lower FT. I would be cautious holding ETFs from iShares in tax deferred due to large swings in FT (no FTC there). For taxable, I would be cautious about holding ETFs from VG and would prefer ishares ETFs due to consistently better QDI.
Personally, I will be moving away from my VXUS holdings in taxable to IDEV (whenever TLH is available) and balance the global allocation with Emerging in 401K. I can't justify paying so much in taxes for Emerging with such consistently poor QDI.
I was annoyed enough to do a multi-year numerical analysis to see if this is a one-off or actionable. Below is the detailed analysis including various components of this inefficiency showing that some commonly discussed views (index selection) are NOT the main issue.
Summary QDI -> non-QDI dividend increases taxes by ~2X. For 2023 VG delivered ~15% worse QDI in its main International funds compared to both a) iShares equivalents for 2023 b) VG own funds for 2022. The TER (Tax ER) compared to a straight swap is 8 BP and for a more complex swap (Dev in Taxable + Emerging in tax deferred) ~17 BP. Index Selection doesn't seem to be the main cause. Likely cause seems to be fund structure: VG uses single fund, multiple shares class covering both taxable and tax deferred. This structure can't optimize BOTH taxable/tax deferred simultaneously. Blackrock offers (IMO) a more tax efficient mouse trap by using a different fund structure: ETF for taxable and CIT for retirement/401K.
Data
Image may be NSFW.
Clik here to view.
Data Sources
Vanguard
https://advisors.vanguard.com/content/d ... SFTCWS.pdf
https://personal1.vanguard.com/pdf/FTC_2023.pdf
https://personal1.vanguard.com/pdf/FASF ... 012022.pdf
Blackrock/iShares
https://www.ishares.com/us/literature/t ... tamped.pdf
https://www.ishares.com/us/literature/t ... tamped.pdf
https://www.ishares.com/us/literature/t ... ummary.pdf
QDI Differences for Equivalent Funds
Image may be NSFW.
Clik here to view.
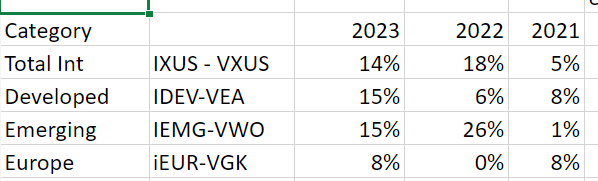
Looking at 2023 vs. 2022, within VG, we see that the main International funds of interest to Bogleheads (Total International, Developed, Emerging) were worse by ~15%. Looking at the next chart which focuses on Blackrock vs. VG performance each year, we again see ~15% for 2023.
Tax Expense Ratio (TER) QDI -> non-QDI classification of a dividend raises your taxes by ~2X. For higher tax brackets, QDI-> non-QDI moves tax bracket from 20% -> 37% or a 17% increase. At lower tax brackets, it moves from 15% for QDI to ~30-32% for non-QDI. I averaged both brackets to get ~17% increase for QDI -> non-QDI. State taxes usually don't care about QDI (for the states I have lived in). 12 month trailing dividend yield across these funds was ~3.3% (~2-2.25X of US funds). NIIT is applicable to all so irrelevant to this discussion.
A straight swap from say VXUS -> IXUS or VEA -> IDEV or VWO -> IEMG would generate: dividend yield * QDI difference * tax bracket difference = 3.3% * 15% * 17% = 8.4 BP.
A more complex swap would be to move emerging from taxable to tax deferred (it is getting ridiculously tax inefficient in taxable) and only keep developed in taxable. That would lead to ~30% improvement in QDI, leading to ~3.3%*30%*17% = 17 BP.
Given ever present discussions here on Bogleheads about 1-2 BP differences in funds, these tax differences (TER) are IMO meaningfully larger numbers and overshadow any actual fund ER differences.
Causes of Tax Inefficiency
Different Index: In previous discussions, several folks have argued that MSCI vs. FTSE index followed by ishares vs. VG could be the cause for tax inefficiency. I looked into it and the index differences are far too small.
First consider developed Europe. Vanguard Europe ETF (VGK) and ishares iEUR both track developed Europe all cap. Most of the market cap comes form western Europe (including UK), where countries have historical ties to US and often have tax treaties to avoid double taxation. Getting good QDI should be easy here and indeed iEUR delivers close to 100% QDI (sometimes even better than US local funds like VTI). Yet VG (VGK) trailed by 8% on QDI.
Next lets consider IDEV vs. VEA for developed. Here the main difference is Korea: VG classifies it as developed while MSCI/ishares classifies it as emerging. Both classify Taiwan as emerging Image may be NSFW.
Clik here to view.
According to VG, Korea is ~4.4% of VEA so it can't explain > 4.4% difference in QDI. Next level of accuracy, looking at Korea's dividend yield and QDI, I used the Korea country specific ETF from ishares EWY. It has 12 month trailing yield of 2.8% and QDI of 44%. VEA had ~3.3% yield and QDI of 73%. So if we remove Korea from VEA to basically create IDEV, we find that the QDI should improve by <1.5%. The actual QDI was off by 15% or ~ 10X bigger than the index difference due to Korea. Clearly, index is not the big factor in this case.
Similarly, for total International (VXUS vs. IXUS), the slight difference is handling of A vs. H shares for China. All of China is only ~6.5% of IXUS (or VXUS) so a slight difference in A vs. H (small part of this 6.5%) can't lead to 15% difference in QDI.
Overall, I conclude that the actual QDI difference delivered is ~1 order of magnitude larger than anything explained by index selection. So, then what explains it?
Taxable vs. Tax deferred optimization by Fund manager
For taxable, ideally we want 0 or low dividends, all of which should be QDI. Foreign taxation is compensated by FTC. Making distributions QDI may increase Foreign Taxes but that is a good tradeoff due to FTC. In tax deferred, dividends and QDI are irrelevant other than their impact on Foreign taxes. Foreign tax minimization should be a primary goal due to double taxation (no FTC).
These optimizations are somewhat opposite. If a fund has to span both taxable/tax deferred (Vanguard), it needs to chose. If separate investment vehicles are used by the Fund company e.g. Blackrock, they can do somewhat better with same level of competency.
A fund manager has little control over total dividends (once index is selected), other than sampling. They have considerable leeway on QDI and foreign taxes.
Most obvious are ADR holdings. By law, stocks held in some countries can't be QDI. Consider Taiwan. It is ~5% of VXUS/IXUS and also has the world's largest company outside US (TSMC). Its dividends were classified 100% non-QDI as seen by the country specific ETF EWT from ishares. However, holding TSMC as its ADR would lead to 100% QDI Image may be NSFW.
Clik here to view.
Security lending is another obvious lever around the 60 day period of QDI/non-QDI dividend. Interestingly, foreign tax withholding can be optimized depending on the entity being lent to. Sampling vs. full replication is a factor.
The main thing here is that QDI and Foreign Taxes are not constants and may move in different directions depending on these optimization decisions. So, lets look at FT data
Foreign Tax Differences for Equivalent Funds
Image may be NSFW.
Clik here to view.
Note that to get a sense of equivalent numbers in comparing the QDI and FT chart, QDI should be multiplied by 0.17: a 10% change in QDI is ~same as 1.7% difference in FT. So, these tax differences are meaningfully large.
The top chart shows that VG has delivered a much more controlled range in FT. The range from iShares is much larger. Looking at some outliers, for 2022 the Europe ETF withheld ~4X higher taxes than VG and IXUS withheld ~2X more taxes than VXUS Image may be NSFW.
Clik here to view.
IMO all this shows that VG and iShares are doing different optimizations due to fund structure.
Vanguard fund total assets in taxable vs. tax deferred
VG has an advantage over traditional mutual fund companies due to its patented innovation of bolting an ETF class onto mutual fund (and classifying all as share classes of the same fund). This lets them be better for capital gains in taxable. However, being share classes of the same fund, it has no way to differentiate between taxable/tax deferred. For optimization, lets look at how much of VG is in different buckets.
For US total Index Fund (VTI), out of total assets of 1.5T, its ETF class VTI has 356B = 24%. For total international VXUS, the total assets are 398B and ETF class VXUS has 63B = 16%. ETF and admiral shares are used in both taxable/tax deferred but the total assets are still dominated by the institutional+ type of classes which are used in 401K. It makes sense given these ratios, that VG fund managers need to weigh tax deferred optimization heavily.
Blackrock has the advantage because its ETF and CIT may follow similar/same index but are not different share classes of the same fund (my understanding). As such, they could potentially be optimized separately (meaning the higher FT seen in ishares ETF may not show up as a problem in tax deferred CIT).
Tax deferred benchmarking
To see if my hypothesis is correct, I looked into benchmarking my 401K funds. I am lucky to have both VG and Blackrock funds in my employer 401K. Their absolute 10 year performance appears identical (with small leeway for index selection). So, I don't see any obvious foreign tax disadvantage with Blackrock when benchmarking in 401K.
I can't obviously link to my employer 401K benchmarking data so lets try using public data. For VG, benchmarking is trivial as the same funds are available (1 BP lower due to share class). For Blackrock, I couldn't find the exact equivalent to the total international in my 401K but this fact sheet from Schwab is the closest I could find.
https://content.schwabplan.com/funddetail/ACWIXUSM.pdf
Note that there are some gotchas in reading their benchmarking charts. VG uses a gross index to show its tracking either on its own site or say using Morningstar. The Blackrock fund in my 401K and a similar one I linked to at Schwab, uses a net index MSCI ACWI ex USA Net Dividend Return Index. This index already removes Foreign taxes without disclosing how much withholding. So, you can get a false sense that it is doing much better than it actually is. Notice that the Schwab link says the fund has outperformed its index by ~20 BP each year averaged over 10 years, implying a negative ER and amazing performance. That isn't real because it is comparing to the NET index. What it DOES show is that foreign tax hasn't been a huge issue in its tracking.
I think mixing gross and net indexes is misleading and I used absolute returns for both in my 401k and VG, Blackrock are very close.
Conclusion: For 401K/tax deferred accounts, mutual funds or CITs by the big players for International seem fine. If I needed to hold ETF in tax-deferred (I don't need to due to excellent 401K funds) I would prefer VG due to lower FT. I would be cautious holding ETFs from iShares in tax deferred due to large swings in FT (no FTC there). For taxable, I would be cautious about holding ETFs from VG and would prefer ishares ETFs due to consistently better QDI.
Personally, I will be moving away from my VXUS holdings in taxable to IDEV (whenever TLH is available) and balance the global allocation with Emerging in 401K. I can't justify paying so much in taxes for Emerging with such consistently poor QDI.
Statistics: Posted by Dirghatamas — Wed Feb 28, 2024 9:23 pm — Replies 5 — Views 724