I hope I'm understanding the "10-year breakeven inflation rate" correctly. According to the FRED website, it is "The breakeven inflation rate represents a measure of expected inflation derived from 10-Year Treasury Constant Maturity Securities (BC_10YEAR) and 10-Year Treasury Inflation-Indexed Constant Maturity Securities (TC_10YEAR). The latest value implies what market participants expect inflation to be in the next 10 years, on average. "
In other words, if the 10-year breakeven inflation rate is higher than actual inflation in the following 10 years, those who bought TIPS is worse off than buying regular 10-year T-note; vice versa. It provides a measure to compare the real-life performance of 10-year TIPS or 10-year T-note at the same time of pricing.
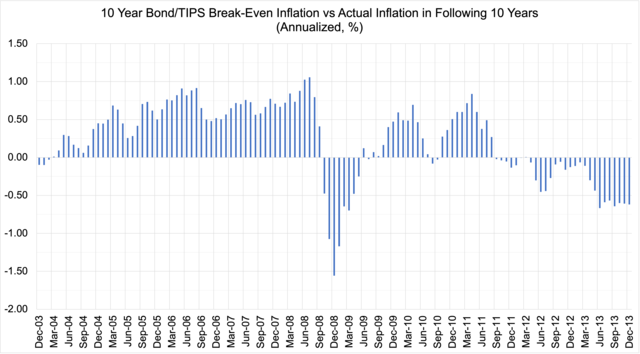
Using these two series of data from FRED: https://fred.stlouisfed.org/graph/?g=1eXYW, that is, CPI and 10 year breakeven inflation rate from Dec 2003 through Dec 2023, a comparison was done between 10-years TIPS vs 10-year T-note priced at the same time, as charted below:
![Image]()
Positive values mean 10-year TIPS underperformed 10-year T-note in the subsequent 10 years;
Negative values mean 10-year TIPS overperformed 10-year T-note in the subsequent 10 years.
What is interesting is, those who bought 10-year TIPS at issuance between 2003 and most of 2008 didn't see the anticipated inflation happen, and therefore was worse off than buying the regular 10-year T-note. Thanks to the post-Covid high inflation, those who bough 10-year TIPS as new issue between June 2011 and December 2013 would be better off than buying 10-year T-note, if holding until maturity.
I searched and saw a few posts comparing TIPS vs bond, and saw similar posts but didn't see a chart (sorry if I missed anyone's previous contribution.)
The lesson I'm drawing is:
In 10 years of time frame and for the purpose of holding until maturity, betting 10-year TIPS vs regular 10-year T-Note is like market-timing; one cannot reliably do it right.
What do you think?
In other words, if the 10-year breakeven inflation rate is higher than actual inflation in the following 10 years, those who bought TIPS is worse off than buying regular 10-year T-note; vice versa. It provides a measure to compare the real-life performance of 10-year TIPS or 10-year T-note at the same time of pricing.
Using these two series of data from FRED: https://fred.stlouisfed.org/graph/?g=1eXYW, that is, CPI and 10 year breakeven inflation rate from Dec 2003 through Dec 2023, a comparison was done between 10-years TIPS vs 10-year T-note priced at the same time, as charted below:
Positive values mean 10-year TIPS underperformed 10-year T-note in the subsequent 10 years;
Negative values mean 10-year TIPS overperformed 10-year T-note in the subsequent 10 years.
What is interesting is, those who bought 10-year TIPS at issuance between 2003 and most of 2008 didn't see the anticipated inflation happen, and therefore was worse off than buying the regular 10-year T-note. Thanks to the post-Covid high inflation, those who bough 10-year TIPS as new issue between June 2011 and December 2013 would be better off than buying 10-year T-note, if holding until maturity.
I searched and saw a few posts comparing TIPS vs bond, and saw similar posts but didn't see a chart (sorry if I missed anyone's previous contribution.)
The lesson I'm drawing is:
In 10 years of time frame and for the purpose of holding until maturity, betting 10-year TIPS vs regular 10-year T-Note is like market-timing; one cannot reliably do it right.
What do you think?
Statistics: Posted by BetterPaws — Tue Jan 30, 2024 7:25 pm — Replies 1 — Views 341