I have done very well with TIAA Real Estate. I maxed it out, saw it go up in 2021 and 2022 and got out. But timing is lucky.
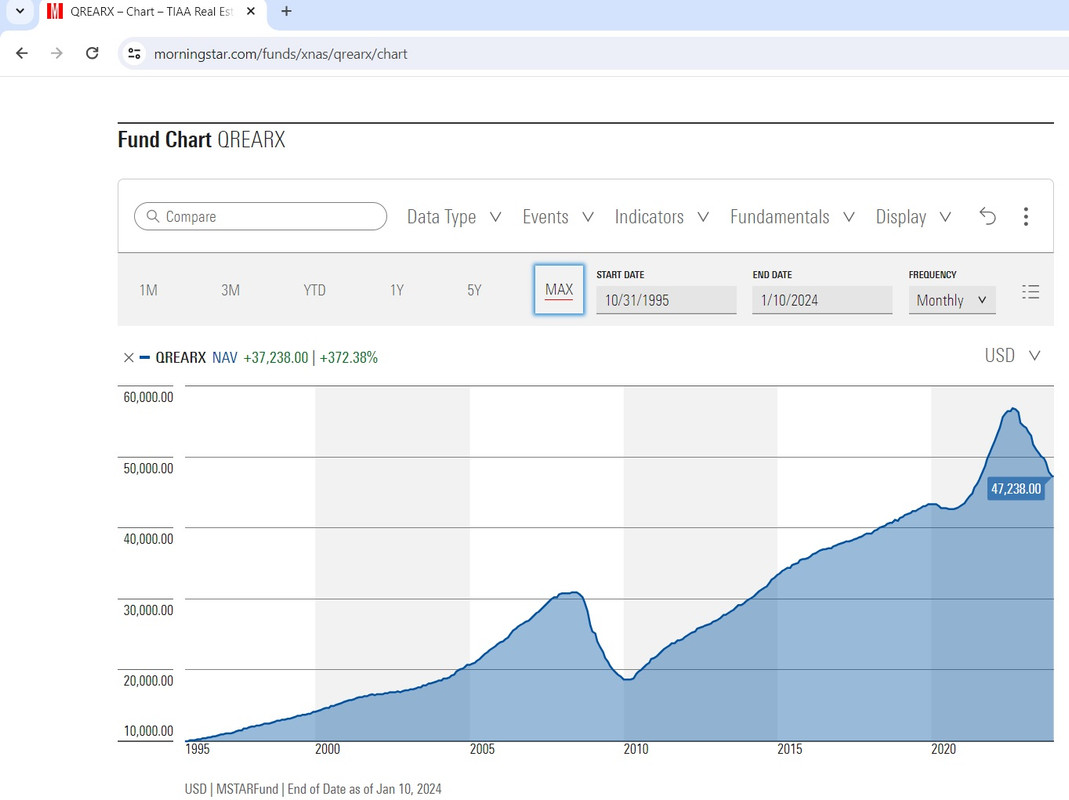
When I sold, I thought I will definitely being rebuying. In deciding on getting back in versus simplifying, I stumbled into this maxing out the chart on M*.
![Image]()
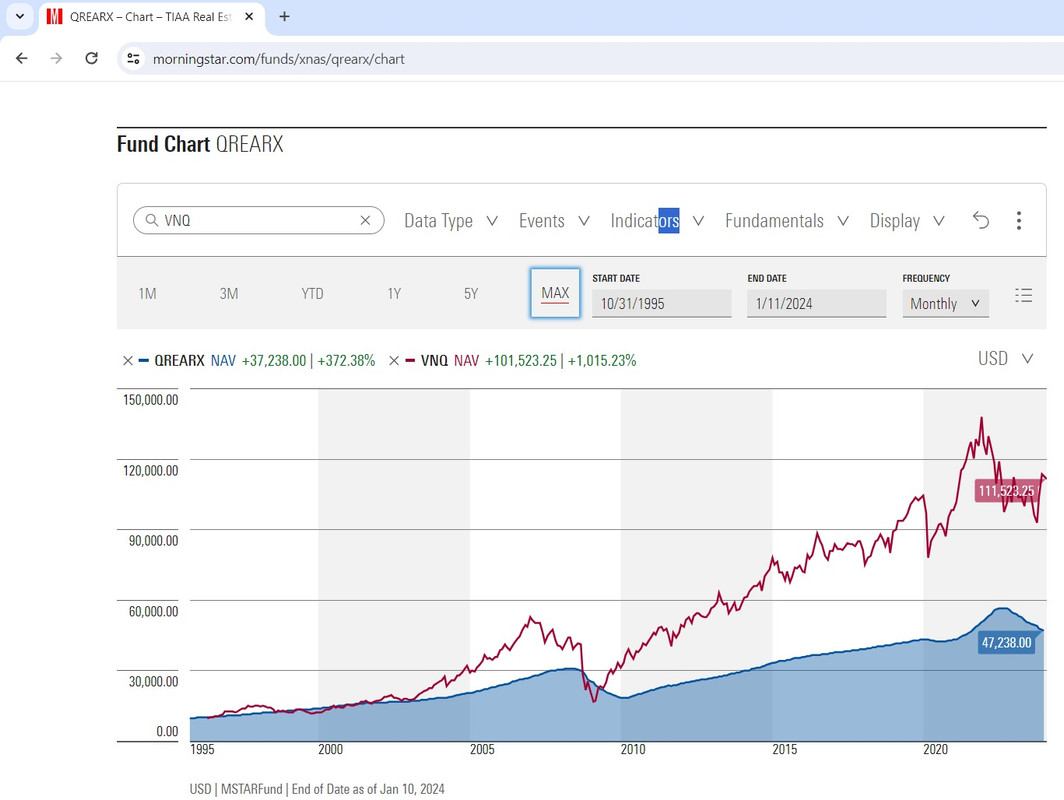
Beautiful right? Particularly if you can time it. Then I compared it to a REIT index ETF - VNQ.
![Image]()
I know one is direct real estate, and one is a fund of REITs. I also understand why expense ratios are different and that you pay for liquidity with direct real estate.
But the return differences are stunning. Plus, I own REITs as part of my stock holdings.
Just reconsidering.
When I sold, I thought I will definitely being rebuying. In deciding on getting back in versus simplifying, I stumbled into this maxing out the chart on M*.
Beautiful right? Particularly if you can time it. Then I compared it to a REIT index ETF - VNQ.
I know one is direct real estate, and one is a fund of REITs. I also understand why expense ratios are different and that you pay for liquidity with direct real estate.
But the return differences are stunning. Plus, I own REITs as part of my stock holdings.
Just reconsidering.
Statistics: Posted by steve r — Fri Jan 12, 2024 4:44 pm — Replies 0 — Views 52